Virtual Design Validation of HVLS / Ceiling Fans

iGloble delivers machine learning based CFD simulation for virtual testing of High Volume Low Speed (HVLS) / ceiling fans resulting in reducing the design to manufacturing cycle times by at least by 22%.

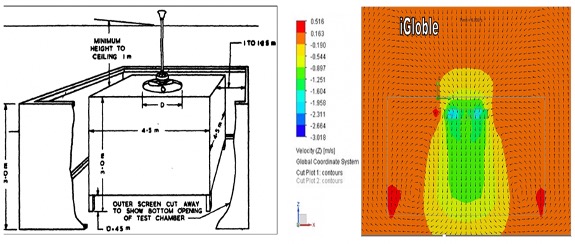
One of the critical factors in the design of new ceiling fans is Air Delivery. Air Delivery is the volume of air that the ceiling fan is able to deliver per unit time, measured at a particular height when rotating at a particular rpm. Air Delivery is usually expressed in m3/min. Air Delivery is measured in a test setup specified by the Indian Standard IS – 374 – 1979, page 15. The test setup is shown in Figure 1. Once the test is setup, elaborate measurements of air velocity are taken by an anemometer. The measurement procedure is outlined below:

A cost effective and quick alternative to such tests is a Virtual Test using CFD (Computational Fluid Dynamics) tools. A CFD simulation can be done on the 3D model of the HVLS / ceiling fan and the Air Delivery can be obtained without actually manufacturing the prototype of the new design and without setting up the elaborate test setup.

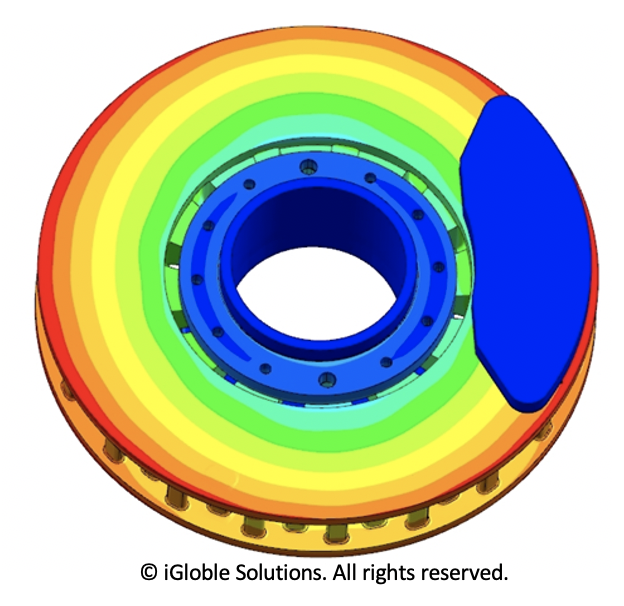
In order to check how the CFD results compare with actual test data, a popular brand of ceiling fan available in the market was taken. A 3D scanning was done and the geometry was converted into a 3D model. A CFD analysis was done on the 3D model, to find out the Air Delivery. The physical model was also tested in a laboratory for Air Delivery. The images given below show the CFD model and the results of velocity obtained from it. It takes about 8 hours to setup, solve and post-process the CFD model. The Air Delivery obtained from the CFD model was 208 m3/min.

Physical tests were performed on the same model in a laboratory, the Air Delivery obtained was 211 m3/min. The value of Air Delivery obtained from CFD analysis is therefore very close to the value of Air Delivery obtained from physical lab tests.

CFD analysis performed is therefore a very cost effective and accurate alternative to Physical laboratory tests for finding out the air delivery for new designs of ceiling fans.

For a demo or questions, please contact Sales@igloble.com

iDesign – Brake Disk Optimization

For a brakes design engineer, knowing the surface temperature of the brake disk is critical for predicting the brake pad wear. Surface temperature computation. is very difficult as it depends on number of variables such as material properties of disk, initial speed, final speed, disc outer diameter, inner diameter, flange thickness, car weight, and distribution of weight on front and rear axle.

iGloble has developed a cloud based solution for brake disk optimization that calculates the surface temperature of a ventilated brake disc for different input parameters mentioned above. The thickness for disk can be varied along with the mass of the disk for the most optimal disk surface temperature.

In most applications the total thickness of the brake disc is constant and the design engineer has the flexibility to change only the flange thickness of the disc. Increasing the flange thickness reduces the surface temperature, but also reduces the area of the vents available for forced convection. It increases the weight of the disc as well. This application will therefore help the design engineer decide on the most optimum flange thickness of the brake disc.

This Brake Disk Optimization application will help the design engineer to determine the brake disc surface temperature for any car, any disc size, any brake pad material and any braking severity.

In case you are interested in a demo, please contact us as sales@igloble.com.

Testing new designs virtually

After a new design of a component or system has been made, lot of time and cost goes into physically testing the design to check its performance. The new design of a component/system is fitted in a car and driven over thousands of kms. Sometimes these tests go on for six months or more. Using Machine Learning, we can check the performance of a new design, virtually, by subjecting it to the same driving conditions and road conditions, the data of which has been collected previously. And once the driving and road data is available, it would take a few minutes to check the performance of the new design.

Predicting Component Failures Using Machine Learning

Components in an automobile fail over time because of wear and tear, which accelerates based on the driving behaviour, terrain, ambient temperature,etc. How do we measure that? and can it be predicted with a good amount of accuracy? If it can, this can save a good percentage of maintenance dollars in addition to lowering insurance claims and recalls cost. Machine learning and AI are driving a change … for predicting failures.

Let us take the example of a automotive brake disc and brake pad. Today, it is impossible to predict when the brake liner has completely worn off, without actually dismantling the wheel and taking physical measurements.

Huge amounts of data is generated on a continuous basis from a vehicle but very little analytics is carried on that data which means we are losing a lot of good information that can be used for real time analyses of the vehicle health and for systems such as brakes, suspension, steering, engine, etc. Machine learning can be used for analyzing the data for failure of certain components such as brakes. By processing speed, temperatures, accelerations, braking etc. data, predictive models can be created for computing disk and pad wear. Machine learning models along with AI can incorporate Driving Conditions, Driver Behaviour, Car Parameters, Road Conditions and Climatic Conditions to calculate the exact wear. This is a paradigm shift from distance travelled based maintenance (preventive) to predictive (& prognostics) based maintenance. This can be a savings of almost 5-7% of the annual maintenance spend.

In the above picture, the vehicle is predicted to have less that 15% of life left, and should be replaced immediately.

In the above picture , car 1 driver has the worst driving behaviour and hence will have to change a certain component first amongst the 5 cars. This is possible only if we run the prognostics using machine learning and AI.

dashboard for data analytics

Reduce Maintenance Costs thru Predictive Analytics

The aviation industry is grasping for opportunities to reduce costs. Big data has been making headlines in several industries, promising to revolutionize the way in which businesses are able to make decisions. One of the sectors slated to benefit from the use of big data, and associated analytics, is the aviation industry. As new aircraft generate more in-flight data compared to older ones, innovative analysis methods summarized. Last studies show a reduction of maintenance budgets by 30 to 40% if a proper implementation is undertaken.by Big Data Analytics enable the processing of large amounts of data in short amount of time.

Maintenance using Predictive Analytics can be described as “the intelligent way to maximize machine availability”. With the right information in the right time it is possible to determine the condition of in-service equipment in order to predict when maintenance should be performed. As a result, it is possible to conveniently schedule corrective maintenance actions, preventing equipment failure.

Over the last several years data generated by aircraft has increased exponentially thru introduction of new onboard equipment that allows for the so-called connected aircraft. In the wake of this data growth OEM’s and airlines have shown increased interest in data analytics and predictive maintenance.

According to the MRO survey 2017 by Oliver Wyman 77% of respondents want to implement predictive maintenance in the coming three years. The MRO survey 2017 by Aircraft IT confirms this trend as most respondents answered that next to paperless maintenance predictive maintenance will play a major role in the development the upcoming years.

customer engagement platform

Role of Predictive Analytics to deepen Customer Engagement at Airlines

These days through advancements in technology and extensive use of Internet, more data is available to be harnessed by Airlines to deliver a more tailored offering that spans the Airline traveller’s entire journey. Loyal customers are truly the backbone of any successful business, given the high percentage of revenue derived from them. It costs significantly more to acquire a new customer than to retain an existing one. For this reason Airlines are shifting to Customer-centric business models for focusing on Individual customer needs.

Airlines have discovered that understanding and predicting Customer behavior is critical to building and maintaining true customer loyalty. Predictive Analytics uses techniques like data mining, statistical modeling, machine learning in predicting Customer behavior patterns to shape business decisions. Predictive analytics help answer the question “ What’s next?” and “What should we do about it?”

Predictive Analytics can provide Customer Insights into where Airlines are or are not meeting Customer expectations. The world is changing and the Customer is in charge. Availability of choice, perceived benefits and personalized value are relevant factors and if Airlines don’t learn about, understand and invest in their customers, they will be left behind. Airlines can benefit from increased sales and market share as well as an increase in customer retention by investing in Predictive analytics. There is no doubt about the escalating significance of Predictive analytics to the Airline Industry.

Fleet management solution

Many public or private organizations like corporate house, government organization, cab companies and fleet owners etc needs to have the system for Fleet management solution which can help them to know current status of their vehicles use. What is the location of the vehicle? What is performance ratio of a particular vehicle or fleet level? What is the fuel efficiency of vehicle?  Without having the detailed information of fleet one can not know how to improve the vehicle performance, lower the maintenance cost or the potential area to make improvement.  Fleet management solution helps to improve your resources (Man and Machine) which turn back as to lower the cost of overall organization.

iotaSmart fleet management solution empowers you to take better decision based on the realtime data of vehicle. By using fleet management solution companies can improve the trips routes, lower the maintenance cost, lower the fuel consumption and improve the fleet utilization.

In iotaSmart we offers you customized solution as per your needs which includes detailed reporting on vehicle locations, health index, mileage, performance and risk etc. Moreover iotaSmart can diagnose your vehicle as well, with Vehicle health tracking system it helps to know about any problem or issue in the engine and its parts. iotaSmart moved forward 1 step and added the artificial intelligence (AI) in the fleet management system by predicting vehicle health. We are working toward to let you know when any problem can come in the vehicle which can be related to engine, tyres and battery etc.

iotaSmart fleet management solution features

  • Track resources – Using the live map fleet and drivers can be tracked real time on map.
  • Optimize resources – While you can track your resources live you increase the productivity and usage easily.
  • Maximize vehicle utilization – Using GPS vehicle can be tracked real time and get the insight of vehicle routes and time taken. By this way vehicle use can be increased by keeping an eye on their ideal time.
  • Real-time alerts – Alerts for high speeding, high RPM, rash driving, fatigue driving, engine issues and idle time etc can be track using the real-time alerts.
  • Vehicle diagnostics – iotaSmart fleet management solution make it easy to diagnose your vehicle like a pro. You can check and diagnose engine trouble codes and engine issues data and definition.
  • Reduce downtime – While you can access your vehicle and diagnose the issues on realtime, it helps you to maintain and have service the vehicle before having any issue. Which reduce the vehicle downtime.
  • High safety – iotaSmart fleet management solution comes with SOS features which can be used in case emergency.
  • Predictive analysis – iotaSmart fleet management solution use advance AI (Artificial intelligence) to make predictive analysis. It helps you to know failure of engine in advance, tyre change and maintenance required etc.

Benefits for using fleet management solution

  • Complete visibility on fleet by 24*7 using mobile app or web system.
  • Increased productivity of resources (Man and Machine)
  • Helps you to reduce the maintenance and service cost and lower the risk of mechanical components failure.
  • Improve driver behaviour and reduce the risk.
  • Improve the fuel efficiency and reduce carbon foot print which helps to reduce the cost of vehicle operation.
  • Identify the high risk activities like over speeding, high RPM, bad driving behaviour.


Connected Cars Security

Security features for Connected Cars

Five Security checkpoints for a connected car

Cyber security has become very crucial these days for connected car environment. The rate of connected car adaptation is simply not meeting the technology changes needed in terms of modern security benchmarking.

A Jeep hack made a lot of news last year where hackers were able to completely take control of Jeep remotely miles away from their home. It’s demonstrated live by the Wire magazine here.

A modern car is typically a computer controlled machine with dozens of ECUs (Electron Control unit) inside it.

Why the ECU security matters now than before?

In a connected car environment car ECUs gets connect to a network, security becomes important when someone is able to tap into your car ECUs remotely without physically present inside the car.  Need for security obviously rises when security can be compromised remotely.

Because the car electronics was not born as internet connected data transmitting and receiving thing, the security might have been ignored in designing the ECUs which continues to be mostly designed like that today.

Back in days when the car didn’t connect to a network it was a good idea for a car’s critical systems to be built on a Controller Area Network (CAN) bus, but now the same CAN bus can be accessed through readily available ports such as an OBD2 port this can potentially act as a gateway to inside your car for a hacker/hacking device.

As modern day vehicles become more connected, they also risk becoming easier to access. Potential points of attack include:

  • Maintenance interfaces: While it is possible to attack traditional IVNs directly through a vehicle’s maintenance interface, a shift to Ethernet/IP networks would make such attacks much easier for anyone with a laptop and basic hacking skills to execute
  • Wi-Fi access points: Wi-Fi access points, if inadequately secured, offer hackers the chance to attack systems from anywhere within 10-15m of the vehicle.
  • Cellular modems: Hackers can call a car’s cellular modem, and use audio signals to launch an attack.
  • Car2x Wi-Fi: Frequently used to warn drivers approaching roadworks, Car2x Wi-Fi (based on the 802.11p standard) affords would-be attackers yet another way into a vehicle’s critical systems.

 Areas where security can be employed in a connected car:

  1. ECU and tapping into CAN buses: ECU should not accept any data coming in without a TIM (Trusted Identity module). These could be vendor specific chips which could be embedded inside the existing ECU setup.
  2. OS and Firmware : Secure OS and Firmware to modern security standards
  3. Car Applications such as infotainment : What’s needed: Application Security rules
  4. Data privacy in connected car environment : Secure access to connected car data with encrypted telematics data push to servers
  5. Access Control: The connected car should connect to a network in a lock down mode – this means the cellular element such as GSM modem should be able to send the data to a predefined white listed server IP. This can be taken care at cellular network level.

Using Internet of Things for Reducing Emissions for a Greener Earth

2015 was the hottest year in the recorded history of temperature. 2016 surpassed 2015. And this is a trend. 2017 is supposed to be very warm once again and most probably beating all the records. Delhi did not have a winter until late January and was very short. The April and May temperatures are going to be higher by another 1.5-2 degrees across India. Northeast US had one of the wettest winters in 2015 until the snow storm late January. The same trend applies to the rest of the world as well. Global climate is shifting to a point of no return because of global warming. Major reasons for this are: carbon dioxide emissions by burning fossil fuel at power plants, burning gasoline by vehicles, methane emissions from animal & agriculture such as rice paddies and finally, deforestation.

Traffic Congestion is getting worse…

Commute times have gone up in the last ten years. What use to take an hour to travel 20 km a decade back, now takes two hours for the same distance in Delhi. The average commute time in Delhi is more than 60 minutes between office and home today. The infrastructure has improved but the numbers of cars in Delhi and travelling through Delhi have grown faster and along with other modes of transportation resulting in a higher density of vehicles leading to lot more congestion and frustration.

And so is burning of fuel and higher emission

Congestion means more of stop and go traffic which leads to lower fuel efficiency and higher emission and in case the car is not healthy, this adds to the woes. A study conducted by iGloble, comprising of 50 cars driven over 250,000 kilometers across India shows fuel efficiency going down to 6 km per liter and lower as the average speed goes below 20 km per hour for a trip as shown in the picture. This means not only we are spending more money today as we are going from location A to B but also causing more wear and tear of the engine potentially leading to engine failure faster. This will result in additional carbon dioxide emissions contributing to already existing global warming situation and higher maintenance spend. For a country such as India where 80% of the fuel is imported, this is a pure wastage.

Need to focus on reducing carbon footprint…to create more efficient car!

Daily commutes have to become more efficient; the vehicles have to become healthier so that less vehicular gasoline is burnt leading to lower carbon dioxide emissions even as we work to improve the driving conditions. There is a need to understand the factors that affect the commute such as time of the travel, mode of transportation, traffic signal efficiency, and efficient routes based on time to reach the destination, fuel efficiency, vehicle health, and maintenance spend:  minimizing the overall spend by the car and fleet owners.

There are millions of devices that are part of the commute infrastructure including the vehicle, infrastructures, traffic lights, roadways, etc and are generating large amount of data every second. Each data point has information attached to it. Identifying and connecting the meaningful information to assist an action is way to go. Using IoT principles to capture real time data from within the vehicles (engine, transmission, acceleration, braking, etc.) and across the vehicles, and available infrastructure, one needs to maximize the throughput in the network with the given and understood constraints. There has to be a paradigm shift from “here and now” to forecasting the network situation with the goal of optimizing throughput with minimum spends across fuel, time, and pain. This has to be communicated to the drivers so that appropriate actions can be assisted with minimal risk. IoT connecting devices and people with process changes make a shift for a better tomorrow to lower the carbon foot print.

How OBDII – On Board Diagnostics is helping build a Safer World

85% of the road accidents happen because of human error. Out of which 36% happens because of driver distraction like taking calls & texting while driving, and fatigue because of long commutes and traffic jams. The yearly insurance claim is to the tune of $940B.  Is there a way to improve the driver and the vehicle safety?

Tracking of vehicles have been happening for some time now through GPS using the web and mobile based apps.  But that is not enough! What is needed is monitoring of the driving behavior real time and how that affects the vehicle performance and maintenance. Driving behavior includes over speeding, hard acceleration, sharp turns, excessive idling, etc. All the above mentioned affect the fuel efficiency and overall working of the vehicle. Add driver fatigue to the equation, the driver and the vehicle risk goes up. Hence, it becomes imperative to measure both the driver and vehicle risk and communicate the same to both the driver and the fleet owners.

Each car manufactured post 1996 has an OBD II (on board diagnostics) port where the OBD II compliant device can be plugged in. This device can receive data from the vehicle (GPS location, 9-axis accelerometer, and engine data) which can then be pushed to the smart phone directly using blue tooth or to the connected cars platform on the cloud using the GPRS technology.

iotaSmart.com, a cloud based smart connected cars platform, that receives data from the connected OBD II device real time, uses a smart analytical engine powered by artificial intelligence and neural networks to analyze the data to generate the driver risk and the vehicle risk indices. Driver risk measures the safety of the driver and the vehicle from an accident perspective and the effect the driving behavior has on the vehicle performance and the associated cost. Driver ratings are published to the owners for appropriate action. This not only improves the driver and vehicle safety but also improves the vehicle health score. The vehicle risk is a measure of the vehicle failure using the real time engine based data and driving behavior leading to excessive wear and tear. Useful life left in the vehicle is computed for predicting the time to failure. Both the driver and vehicle risk index are computed for each trip along with the fuel efficiency; another critical factor for measuring operational efficiency. Furthermore, risk indices are consolidated across the trips to understand the trending over a period of time. The ability to predict vehicle health along with recommendations at the right time for the fleets to identify the high operational cost points for potential cost savings is critical. The platform identifies the worst performing vehicles so that fleets can perform predictive maintenance and diagnostics based repairs on those vehicles for an overall health of the fleet improvement.

The Pizza theory to create Integrated Solutions

Time has come to create solutions that are cutting over from one domain to another. Data can have multiple origins and destinations. What this means is that once data is created, it can consumed by the various verticals such as manufacturing, banking and insurance verticals. This is achieved by transforming data into meaning information for analytics and decision making by that specific vertical. The key here is the type of information needed and hence the transformation that needs to be designed. The aim to use these solutions is to mitigate risks and improve operational efficiency.

“The Pizza Theory” design helps in creating those transformation solutions on the data (generated by an engine of an aircraft or bus or turbine in a hydro power plant). Data is the core of the pizza, toppings are the applications, and finally a slice is an integrated solution across the verticals.

For instance, data from an engine of the bus can be used to predict its failure and also to decide whether to repair /replace the engine. A fleet owner can decide on the fate of its fleet if the engine issue is consistent across all the buses. Same data can be used to communicate to the driver of the bus on the engine condition so that an appropriate decision can be made while in motion. Engine manufacturer can use the same data across all engines to decide if this needs a design change. And finally, insurer for the engines can measure the risk involved here. The slice of the Pizza is built on that engine data.